Look, we’re all stressed.
But there’s a difference between always moaning about how busy you are at work and worrying about whether you’ll even make it there alive, or if your labour will be enough to put food on the table, or if the air you breathe is actually doing more harm than good for your health. (Luckily, Canada has your back if that’s the case.)
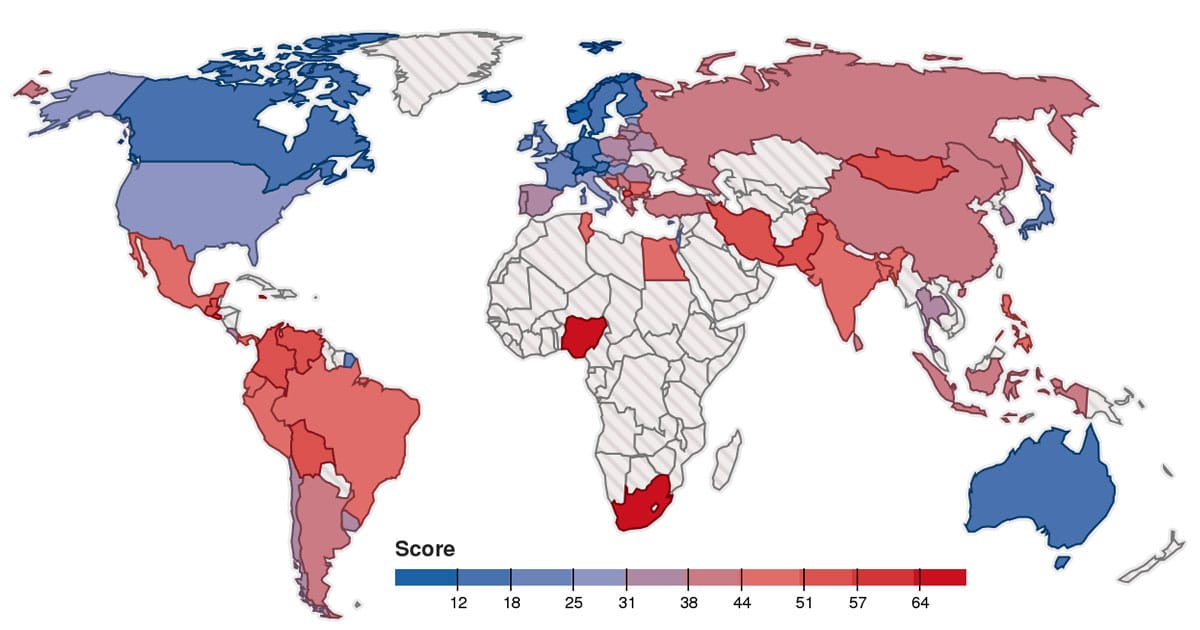
Bloomberg recently released their annual ranking of the word’s most stressed countries, which was calculated by analyzing seven equally weighted variables – homicide rates, GDP per capita (adjusted for purchasing-power parity), income inequality, corruption perception, unemployment, urban air pollution, and life expectancy.
Atlas and Boots explains how the data was broken down:
Countries were allotted points for each variable based on their relative position in that category’s ranking. The country with the least-stressful measure for each variable received 0 points, while the country with the highest stress level received 100 points. All other countries were scored on a percentile basis depending on their position between the two extremes. Points for the seven variables were averaged for a final score from 0 to 100, a higher score indicating a more stressful living environment.
To ensure that countries could be fairly stacked up against each other, only 74 with comprehensive data were included in the study. Unsurprisingly, countries with low life expectancy were determined to be the most stressed. An interesting note is that unemployment rate didn’t necessarily dictate how stressed a country was to the same degree as life expectancy. El Salvador, Mongolia, and Guatemala, for example, each with an unemployment rate under seven per cent, featured among the five most stressed countries.
Canada scored a respectable 65th out of the 74 countries ranked from most to least stressed. So the next time you’re feeling a little overwhelmed, remember how good you actually have it.
The full ranking below:
| RANK | COUNTRY | SCORE | UR (%) | LE (YRS) |
|---|---|---|---|---|
| 1 | Nigeria | 70.1 | 23.9 | 53 |
| 2 | South Africa | 70.0 | 25.7 | 58 |
| 3 | El Salvador | 57.6 | 5.7 | 72 |
| 4 | Mongolia | 55.4 | 6.1 | 68 |
| 5 | Guatemala | 55.1 | 4.1 | 69 |
| 6 | Colombia | 53.6 | 10.3 | 78 |
| 7 | Pakistan | 52.7 | 9.2 | 67 |
| 8 | Jamaica | 52.3 | 13.0 | 75 |
| 9 | Macedonia | 52.0 | 30.0 | 75 |
| 10 | Bolivia | 51.5 | 5.4 | 67 |
| 11 | Iran | 51.4 | 13.4 | 73 |
| 12 | Venezuela | 51.1 | 7.8 | 75 |
| 13 | Bosnia and He… | 50.2 | 27.0 | 76 |
| 14 | India | 48.9 | 9.9 | 65 |
| 15 | Egypt | 46.4 | 13.6 | 73 |
| 16 | Mexico | 46.3 | 4.8 | 75 |
| 17 | Brazil | 45.3 | 6.0 | 74 |
| 18 | Philippines | 45.2 | 7.0 | 69 |
| 19 | Bangladesh | 45.0 | 5.0 | 70 |
| 19 | Ecuador | 45.0 | 5.8 | 76 |
| 21 | Tunisia | 44.8 | 16.7 | 76 |
| 22 | Panama | 44.3 | 4.2 | 77 |
| 23 | Bulgaria | 44.2 | 12.4 | 74 |
| 23 | Peru | 44.2 | 6.8 | 77 |
| 25 | Indonesia | 43.8 | 6.1 | 69 |
| 25 | Russia | 43.8 | 5.5 | 69 |
| 27 | Sri Lanka | 43.4 | 4.9 | 75 |
| 28 | Serbia | 42.7 | 23.0 | 74 |
| 29 | China | 42.3 | 4.1 | 76 |
| 30 | Greece | 41.8 | 27.0 | 81 |
| 31 | Argentina | 40.1 | 7.1 | 76 |
| 32 | Turkey | 38.5 | 9.4 | 76 |
| 33 | Costa Rica | 37.8 | 6.5 | 79 |
| 34 | Latvia | 37.5 | 13.3 | 74 |
| 35 | Thailand | 37.1 | 0.7 | 74 |
| 36 | Croatia | 36.1 | 15.2 | 77 |
| 37 | South Korea | 35.9 | 3.3 | 69 |
| 38 | Lithuania | 35.8 | 12.0 | 74 |
| 39 | Romania | 35.6 | 7.0 | 74 |
| 40 | Chile | 34.4 | 6.5 | 79 |
| 41 | Belarus | 34.1 | 0.6 | 71 |
| 42 | Mauritius | 33.9 | 8.0 | 74 |
| 43 | Portugal | 33.8 | 18.3 | 80 |
| 44 | Spain | 33.1 | 27.0 | 82 |
| 44 | Slovakia | 33.1 | 14.3 | 76 |
| 46 | Poland | 32.8 | 11.0 | 76 |
| 47 | Uruguay | 32.4 | 6.5 | 77 |
| 48 | Italy | 30.4 | 12.0 | 82 |
| 49 | Czech Republic | 30.3 | 8.1 | 78 |
| 50 | Hungary | 30.0 | 10.5 | 75 |
| 51 | Israel | 28.6 | 7.0 | 82 |
| 52 | Estonia | 28.1 | 7.8 | 76 |
| 53 | Cyprus | 27.3 | 12.1 | 81 |
| 54 | United States | 25.7 | 7.7 | 79 |
| 55 | Malta | 25.4 | 6.4 | 80 |
| 56 | Slovenia | 24.6 | 9.8 | 80 |
| 56 | United Kingdom | 24.6 | 7.8 | 80 |
| 58 | Ireland | 24.3 | 14.2 | 81 |
| 59 | France | 22.8 | 11.2 | 82 |
| 60 | Japan | 19.9 | 4.1 | 83 |
| 61 | Belgium | 19.4 | 8.0 | 80 |
| 62 | Singapore | 19.2 | 2.0 | 82 |
| 63 | Austria | 17.1 | 4.6 | 81 |
| 64 | Netherlands | 16.9 | 6.3 | 81 |
| 65 | Canada | 16.6 | 7.3 | 82 |
| 65 | Germany | 16.6 | 5.7 | 81 |
| 67 | Iceland | 15.4 | 5.0 | 82 |
| 68 | Finland | 14.9 | 8.1 | 81 |
| 69 | Denmark | 13.8 | 7.6 | 79 |
| 70 | Australia | 12.2 | 5.3 | 82 |
| 71 | Sweden | 12.1 | 8.1 | 82 |
| 72 | Switzerland | 9.2.0 | 3.2 | 83 |
| 73 | Luxembourg | 7.1.0 | 6.3 | 82 |
| 74 | Norway | 5.4.0 | 3.1 | 81 |
[ad_bb1]